
The Fourth of July is one of the most significant travel periods of the year in the United States, combining a major national holiday with the peak of the summer vacation season. With schools out across much of the country, many families use the holiday to take extended trips, visit relatives, or gather for celebrations. The result is a surge in travel activity that ripples through airports, hotels, restaurants, and tourism destinations nationwide. The scale of that demand is reflected in broader summer travel trends, where AAA projected that a record 45.1 million Americans would travel at least 50 miles from home during the 2026 Memorial Day holiday period. Together, strong leisure demand, America’s 250th anniversary celebrations, and the FIFA Men’s World Cup are likely to put added pressure on air travel during the holiday period.
While Independence Day travel affects virtually every region of the country, the impact is not distributed evenly. Some destinations experience dramatic increases in incoming flights as travelers flock to outdoor recreation areas, coastal communities, and seasonal tourism hubs. Other markets see relatively modest changes in traffic levels or even decreases. Examining these differences provides insight into how Americans choose to spend the holiday and which regions bear the greatest transportation and tourism impacts during one of the nation’s busiest travel weeks.
To better understand these patterns, researchers at Luxury Link, an online booking platform specializing in luxury travel, analyzed domestic airline schedules and operational performance data surrounding the Fourth of July holiday period. The analysis examines seasonal trends in U.S. airline traffic, measures how flight delays and cancellations change during the holiday, and identifies the destinations that experience the largest increases in incoming air travel during Independence Day week.
Key Findings
- U.S. commercial airline traffic has nearly recovered from the pandemic. Scheduled domestic flights fell from 701,274 in March 2020 to 192,412 in May 2020 before rebounding to 675,722 in July 2025, approaching pre-pandemic levels.
- A moderate increase in July 4th holiday flights leads to a sharp rise in flight disruptions. From 2023 through 2025, scheduled domestic flights during the week ending on July 4th averaged 16.3% higher than the rest of the year, while cancellations increased 121.5% and flights delayed more than three hours rose 74.6%.
- Outdoor tourism states experience the nation’s largest Fourth of July travel surges. Alaska (+51.7%), Maine (+50.9%), and Montana (+49.9%) recorded the largest increases in average daily arriving flights during the Independence Day week compared with the rest of the year.
- Pacific Northwest and mountain metros are among the biggest holiday travel destinations. Seattle (+28.1%) and Portland (+25.3%) posted the largest increases in average daily arrival flights among major metropolitan areas during the week ending on July 4th.
Tracking U.S. Airline Traffic Trends
Scheduled domestic flights typically peak in the summer and are approaching pre-pandemic totals
The surge in travel demand surrounding Independence Day reflects a broader recovery in U.S. air travel. After the COVID-19 pandemic triggered an unprecedented decline in airline activity, domestic flight schedules have steadily rebounded toward pre-pandemic levels. According to Bureau of Transportation Statistics data, scheduled domestic flights—commercial flight segments from reporting carriers that exclude cargo-only flight operations and general aviation—fell from 701,274 in March 2020 to just 192,412 in May 2020 as travel restrictions and public health concerns curtailed demand. By July 2025, however, airlines had scheduled 675,722 domestic flights, bringing capacity close to the volumes recorded before the pandemic disrupted travel.
As a part of the broad recovery, domestic airline traffic returned to a predictable seasonal cycle. In 2025, scheduled domestic flights rose 15.8% from January to July, reflecting the typical summer build-up as schools close and leisure travel increases. Pre-pandemic data show a similar pattern: in 2019, scheduled flights climbed from 626,472 in January to a summer high of 692,256 in August. As airlines concentrate more flights into the summer travel season, holiday periods such as Independence Day place additional demands on airport capacity and airline operations.
Luxury Escapes Beyond the Mainland
Puerto Rico experiences one of the largest Fourth of July travel surges among U.S. destinations, reflecting its enduring appeal for travelers seeking beaches, culture, and warm-weather getaways. Explore some of the best Puerto Rico 5-star luxury hotels for an elevated island experience.
How Are Domestic Flights Affected by 4th of July Holiday Travel?
Despite a modest increase in scheduled flights, flight cancellations and delays increase dramatically during the July 4th holiday
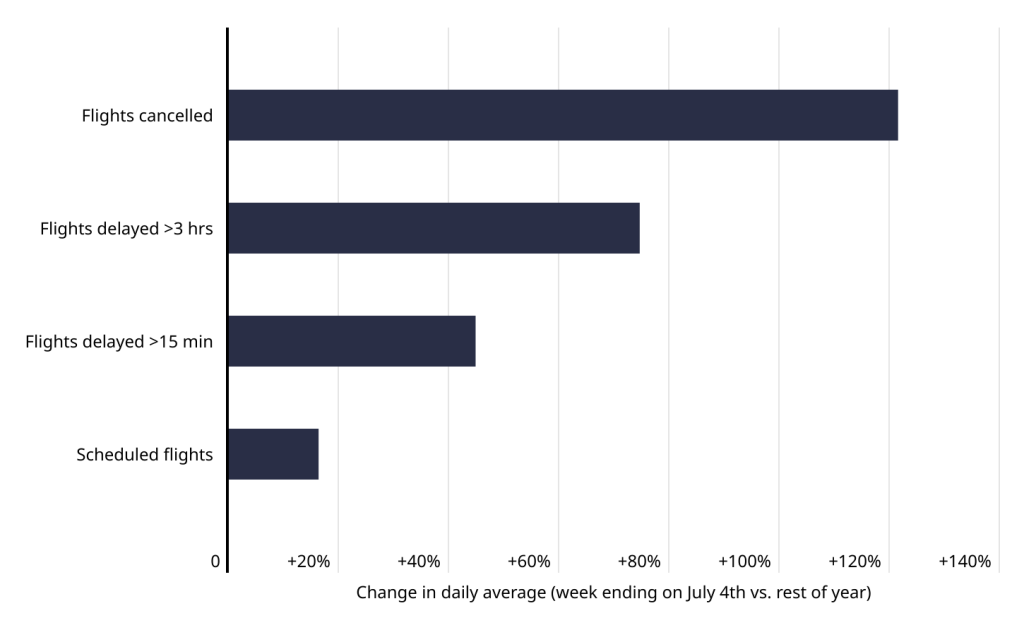
The Fourth of July holiday brings a noticeable increase in airline activity, but even a modest increase in scheduled flights can have an outsized impact on airline operations. Based on averages from 2023 through 2025, the number of scheduled domestic flights during the week ending on July 4th was 16.3% higher than during the rest of the year. The increase reflects the holiday’s position within the peak summer travel season, when airlines add capacity to accommodate stronger leisure travel demand.
Operational disruptions, however, increase at a much faster rate. The average number of cancelled flights during the Independence Day week is 121.5% higher than the rest-of-year average, while flights significantly delayed—flights delayed by more than three hours—increase by 74.6%. Even shorter delays become more common, with flights delayed at least 15 minutes rising 44.8%. These findings suggest that while airlines are generally able to accommodate higher passenger volumes during the holiday period, the combination of increased traffic and seasonal travel demand can make flight operations significantly more vulnerable to disruptions.
Planning Your Next Summer Getaway?
While many travelers flock to popular U.S. destinations during the Independence Day holiday, others use the summer season to explore world-class beach destinations beyond the mainland. Discover the best Cancun 5-star luxury hotels for a luxury escape featuring oceanfront resorts, fine dining, and unforgettable coastal scenery.
Where Are Travelers Flying for the 4th of July?
Outdoor tourism hotspots like Alaska, Maine, and Montana see the largest 4th of July flight surges
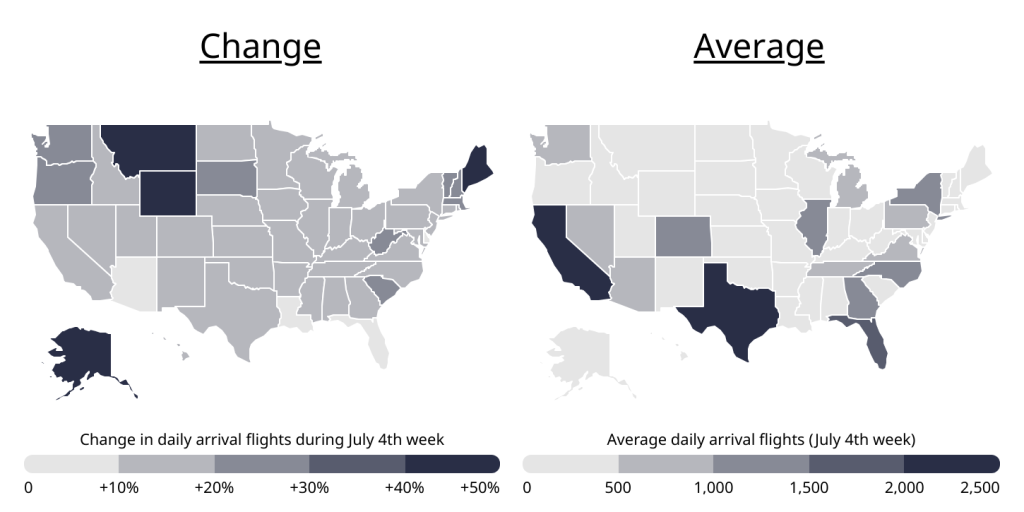
The largest Fourth of July travel surges are concentrated in destinations known for outdoor recreation and summer tourism. Western mountain states, northern New England, and other seasonal vacation markets experienced some of the country’s largest increases in incoming air traffic during the week ending on July 4th. Alaska ranked first nationwide, with average daily arrival flights increasing 51.7% compared with the rest of the year, followed closely by Maine (50.9%), Montana (49.9%), and Wyoming (41.8%). Notably, U.S. territories also see large surges during the July 4th holiday period, with Puerto Rico seeing a 31.3% increase and the U.S. Virgin Islands drawing 23.4% more scheduled flights.
By contrast, several states that already attract significant year-round visitor traffic experienced relatively modest holiday-related increases. Arizona recorded the smallest increase in average daily arrival flights at 3.5%, followed by Louisiana (8.2%), Florida (8.8%), and Georgia (11.7%). While these destinations benefit from established tourism industries that generate consistent demand throughout the year, they also experience some of the country’s most challenging summer weather conditions. Extreme heat in Arizona and high temperatures and humidity across the Southeast may reduce the appeal of these destinations during the peak summer travel season. In contrast, the three states with the largest increases—Alaska, Maine, and Montana—are known for harsh winters that can limit tourism activity during much of the year. As temperatures warm and outdoor attractions become more accessible, travel demand becomes increasingly concentrated during the summer months, helping drive some of the nation’s largest Fourth of July-related surges in air traffic.
The state-level trends are also evident when examining individual metropolitan areas. Many of the largest increases occurred in gateway cities that provide access to outdoor recreation destinations, national parks, and scenic coastal regions. Among large metropolitan areas, Seattle recorded the largest increase in average daily arrival flights during the week ending on July 4th at 28.1%, followed by Portland, Oregon (25.3%) and Fresno, California (23.0%). Other metros posting substantial increases included Spokane, Washington (22.5%), Bangor, Maine (22.4%), and Bozeman, Montana (21.7%). The concentration of fast-growing destinations across the Pacific Northwest, northern New England, and Mountain West reinforces the broader pattern seen at the state level, with travelers gravitating toward regions known for outdoor recreation and relatively mild summer weather.
For a complete breakdown of the most popular U.S. travel destinations, see the Full Results section below where researchers compared domestic scheduled flight increases during the 4th of July period compared to the rest of the year. For more information, see the Methodology section.
Methodology
The data used in this analysis is from the U.S. Bureau of Transportation Statistics’ Airline On-Time Performance database. Researchers at Luxury Link analyzed domestic commercial flight activity and operational performance surrounding the Fourth of July holiday period, using data from 2023 through 2025. To reduce the impact of year-to-year anomalies, all flight, delay, and cancellation metrics were calculated using three-year daily averages.
For the airline traffic analysis, arriving flights were defined as domestic commercial flight segments operated by reporting carriers. The data exclude cargo-only flight operations, general aviation flights, and commercial flights operated by airlines that account for less than 0.5% of domestic scheduled passenger revenue. Researchers compared average daily flight activity during the week ending on July 4th with average daily activity during the remainder of the year. Flight delays were categorized using Bureau of Transportation Statistics definitions, including flights delayed by at least 15 minutes and flights delayed by more than three hours.
To identify the destinations experiencing the largest Independence Day travel surges, researchers calculated the percentage difference between average daily arriving flights during the week ending on July 4th and average daily arriving flights during the rest of the year for each city market and state. City market populations were estimated using U.S. Census Bureau population data. For relevance, the analysis included metropolitan areas, nonmetropolitan markets, and outlying cities with distinct city markets located within larger metropolitan regions. Only locations with sufficient flight and population data were included. Delaware (Wilmington Airport, ILG) was excluded because it lacked qualifying commercial service from reporting carriers during the study period.